Uptime alerts and incidents: when you’re alerted and how to respond
When an uptime monitor goes down, Monity opens an incident, alerts the monitor’s channels, and keeps a timeline of what happened until it is back. Each incident comes with its likely cause and the details of the check that failed, so whoever picks it up knows where to start.
Choose when to be alerted
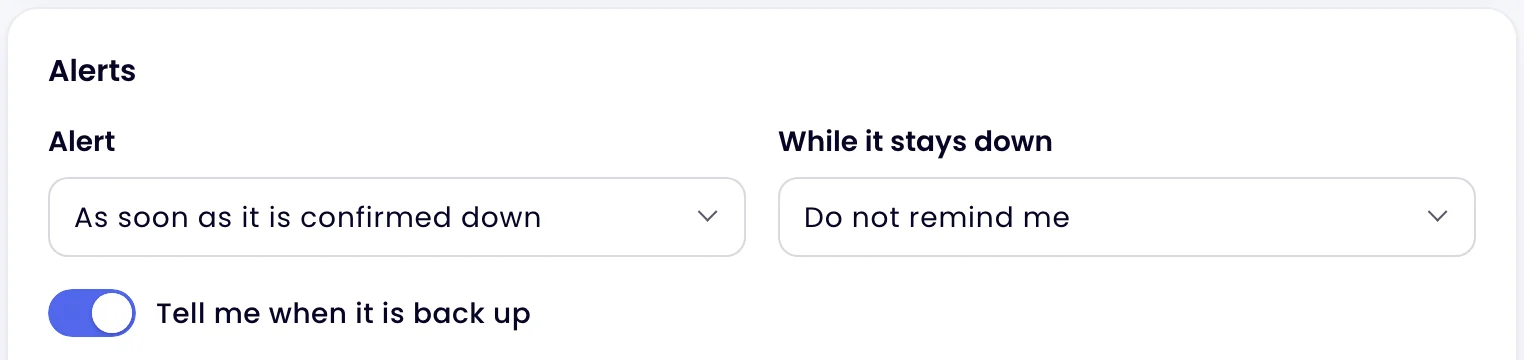
In the monitor’s editor (New monitor, or Edit on its page), the Alerts card sets the timing:
| Setting | Options |
|---|---|
| Alert | As soon as it is confirmed down (the default), or only when it has been down for 1, 2, 5, 10, 15 or 30 minutes or 1 hour. Use a delay for a site that often has short blips you don’t need to hear about. |
| While it stays down | Do not remind me, or a reminder every 15 or 30 minutes, every 1, 3 or 6 hours, or every 24 hours until someone acknowledges the incident or it is back up. |
| Tell me when it is back up | A recovery alert when the incident ends. It only goes out if a down alert did, so a blip that never alerted stays quiet. |
“Confirmed” means the failure repeated on two more checks, 3 and 6 seconds after the first. See Uptime monitoring for how a check decides it is down.
Where alerts go
Under Send alerts to, switch on any of the alert channels you use for other tasks: email (on by default, to every member of the workspace), Slack, Microsoft Teams, Discord, Telegram, Google Sheets, webhooks and push notifications in the mobile app. Each alert names the monitor, what failed and when, and links to the incident.
Uptime monitors alert for more than outages:
| Alert | Sent when | Webhook event |
|---|---|---|
| Down | A failure is confirmed (or has lasted as long as you chose) | uptime.down |
| Reminder | It is still down, at the interval you chose | uptime.reminder |
| Back up | The first good check after a down alert | uptime.up |
| Slow | Three checks in a row slower than your limit | uptime.slow |
| Certificate | The HTTPS certificate expires within the days you set | uptime.ssl |
| Domain | The domain’s registration expires within the days you set | uptime.domain |
Alerts also appear in the Feed and open the monitor at the incident. To send a webhook to an on-call tool, see webhook alerts.
When something is down
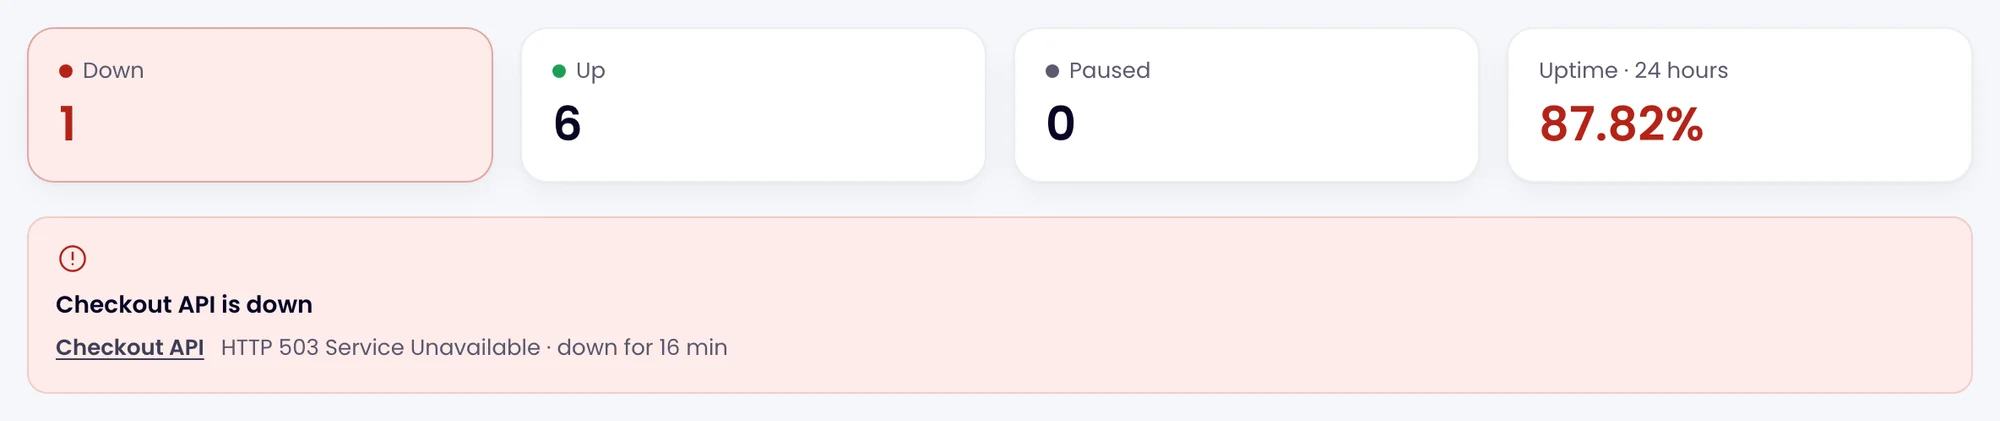
The Uptime page shows a red box naming the monitor, the error and how long it has been down, and the sidebar’s Uptime entry shows a red count.
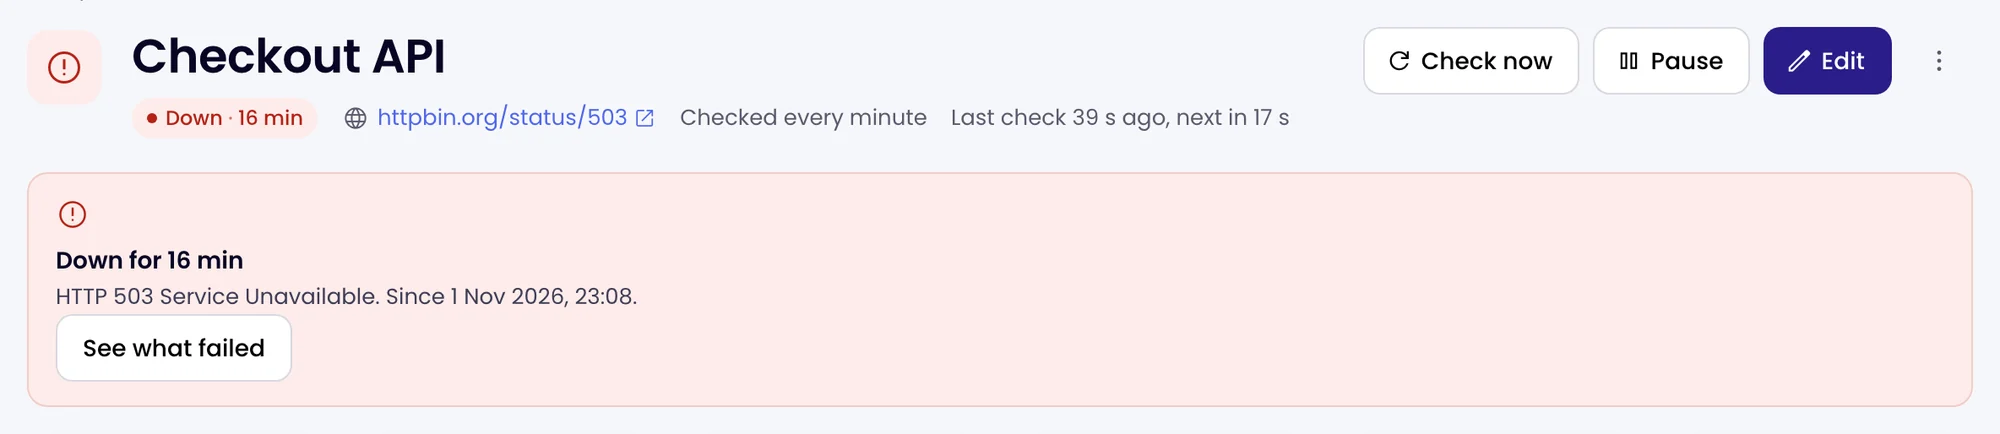
On the monitor’s page, the same box says since when, and See what failed opens the incident.
Handle an incident
Each incident on a monitor’s page opens to show:
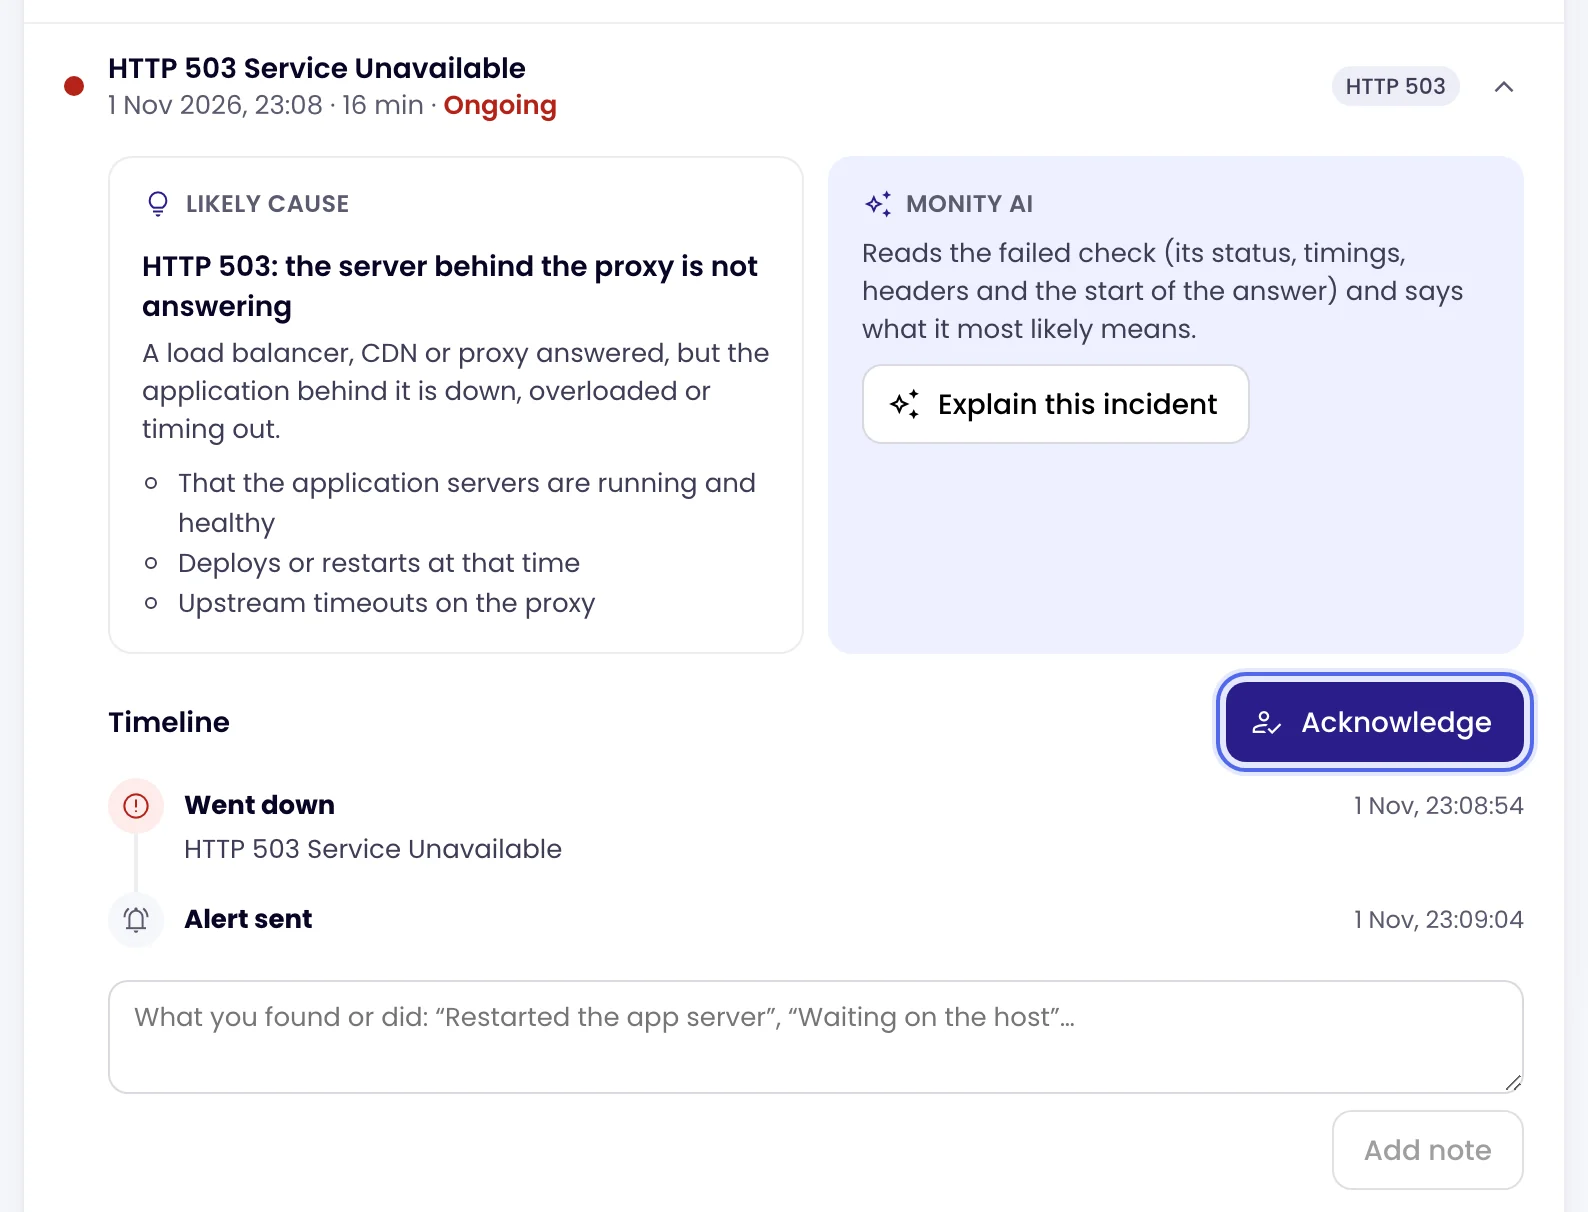
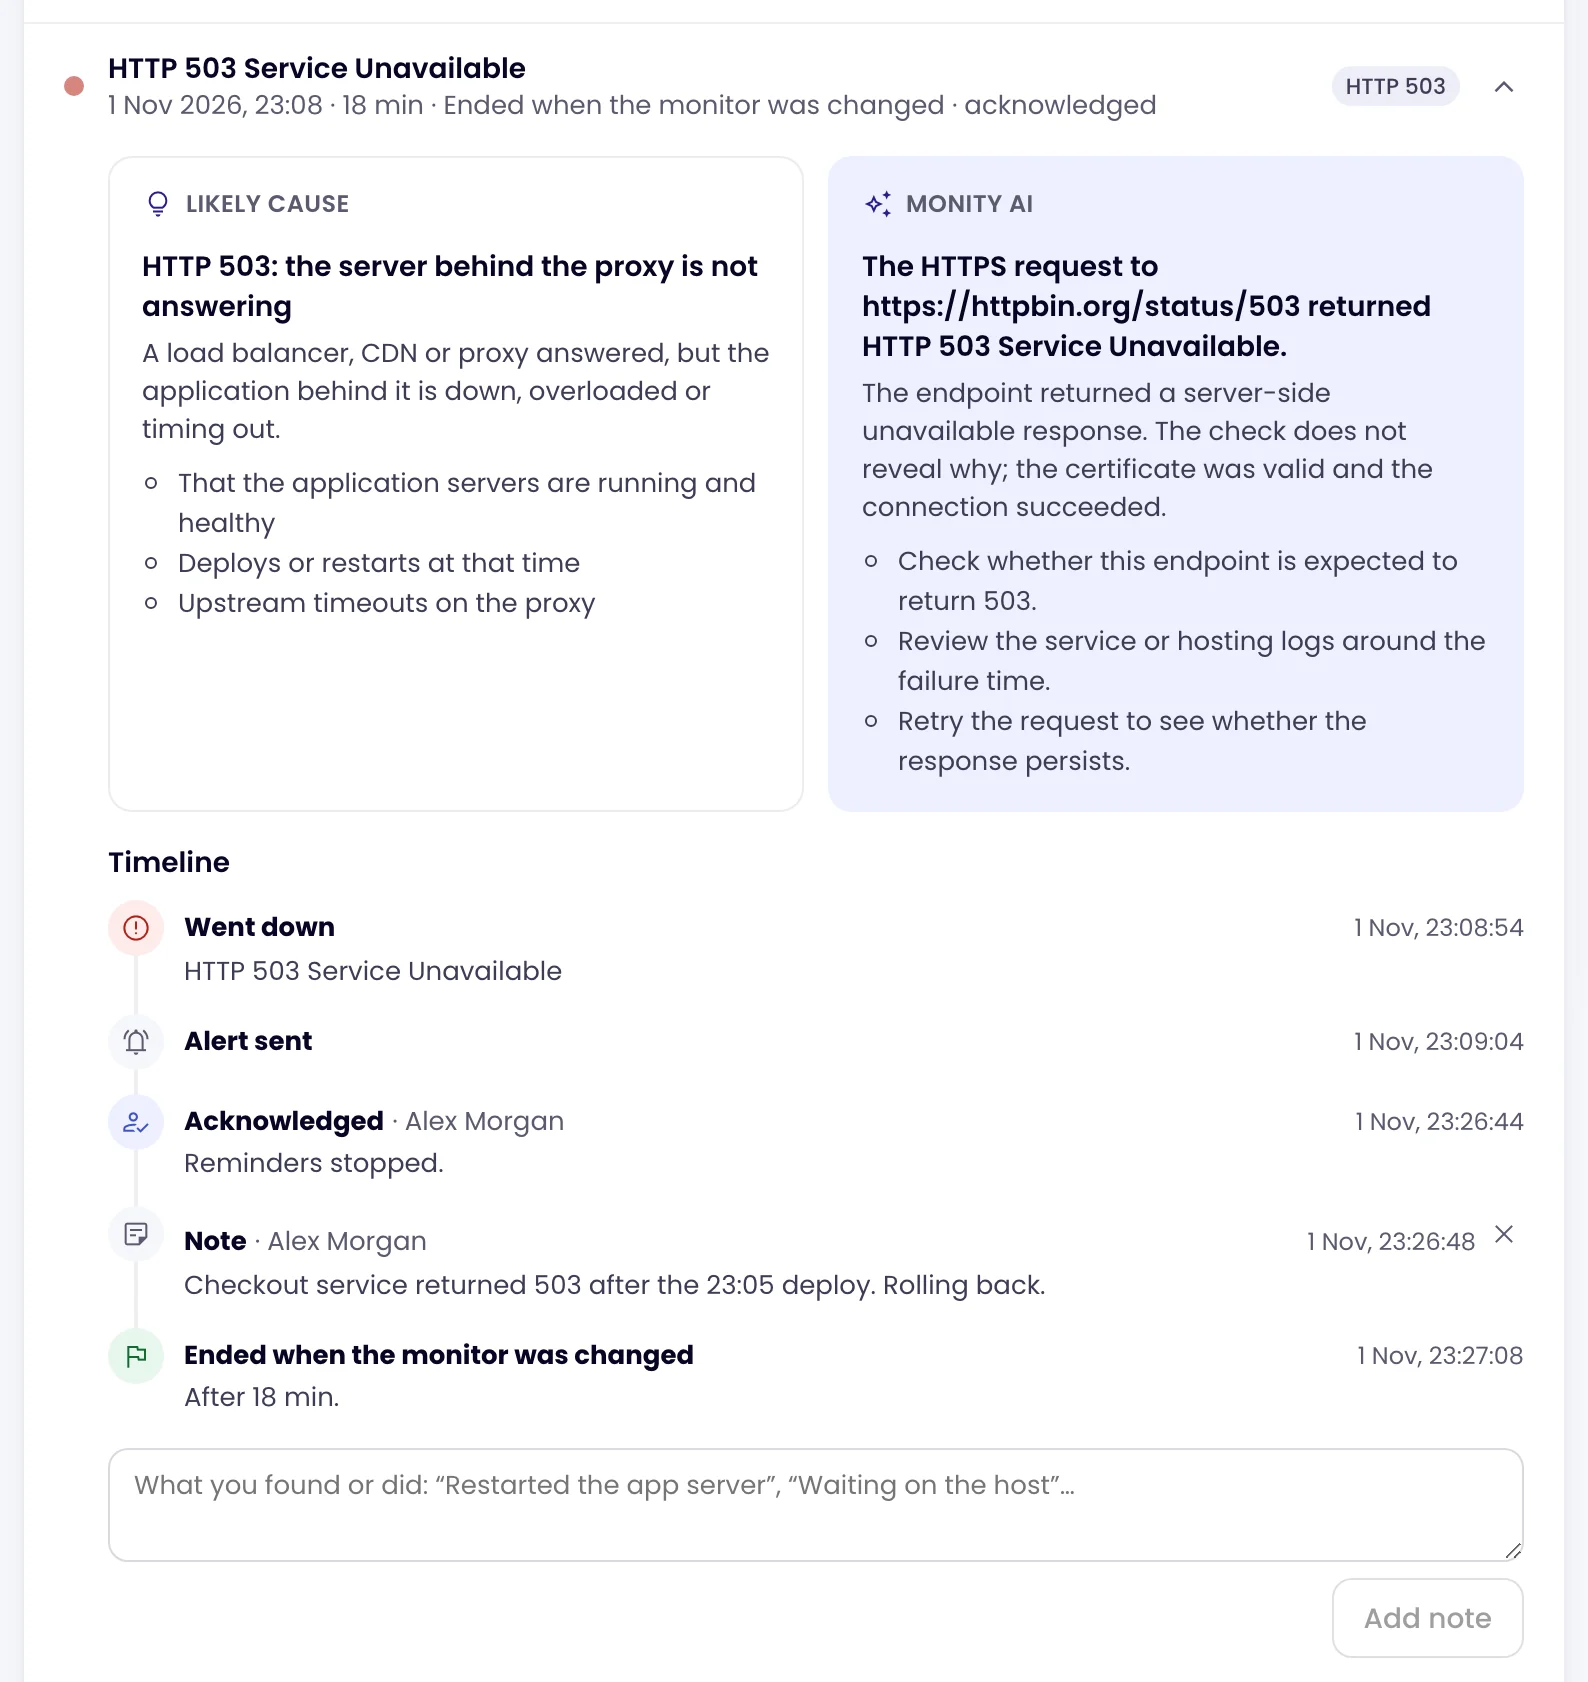
- Likely cause: what the failure most likely means and what to check, from the error itself. For a 503, for example, that the server behind a proxy or load balancer is not answering. It is there for every incident, straight away.
- Monity AI: click Explain this incident and Monity AI reads the failed check (its status, timings, headers and the start of the answer) and says what it most likely means. The answer stays on the incident for everyone.
- What a browser showed: for Website and Keyword monitors, a screenshot of the page taken when the down alert went out, when one could be taken.
- Timeline: when it went down, each alert and reminder, who acknowledged it, notes, and when it ended.
-
Acknowledge it
Click Acknowledge to tell the team someone is on it. Reminders stop, the timeline records who it was, and the incident is marked acknowledged in the list.
-
Add notes
Write what you found or did, such as “Rolled back the 23:05 release”, and click Add note. Notes can be up to 2,000 characters. You can delete your own; admins and editors can delete any.
Acknowledging, notes and Monity AI’s reading are for admins and editors. Everyone who can see the monitor can read them.
The failed check
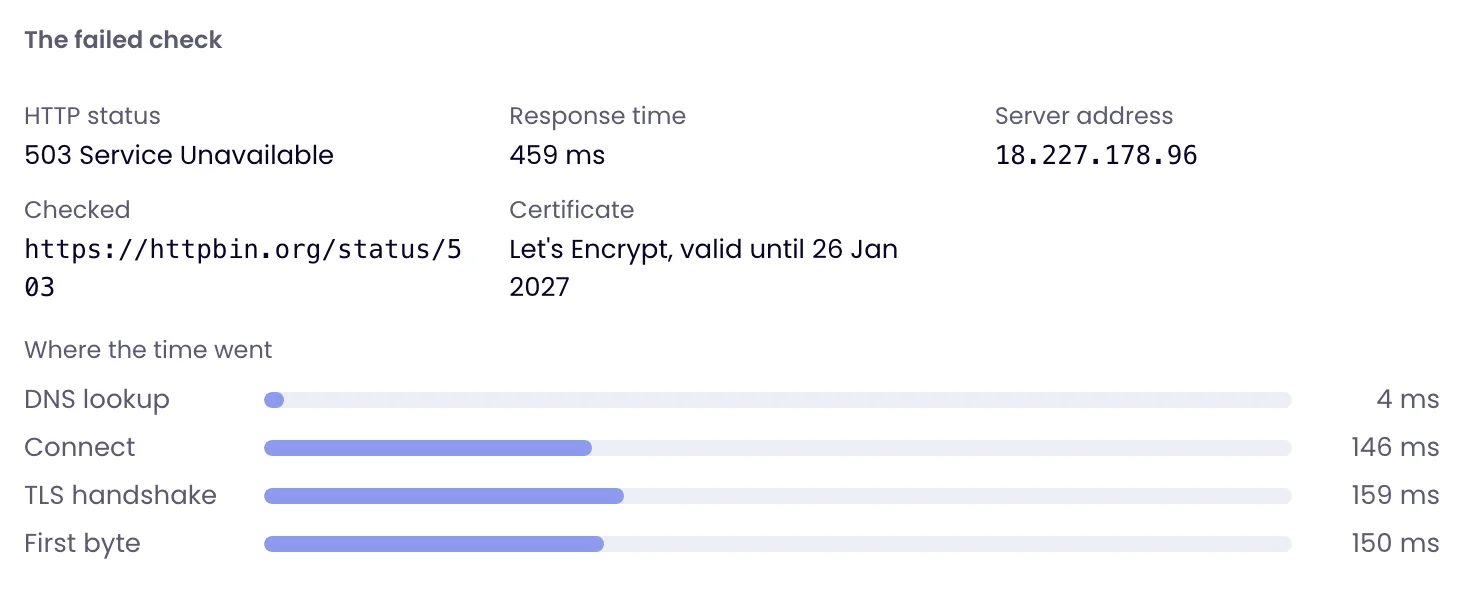
Under the timeline, The failed check lists what Monity saw: the HTTP status, the response time, the server’s IP address, the address it ended up at and any redirects, the certificate, where the time went (DNS lookup, connect, TLS handshake, first byte), the response headers and the start of what the server answered.
How incidents end
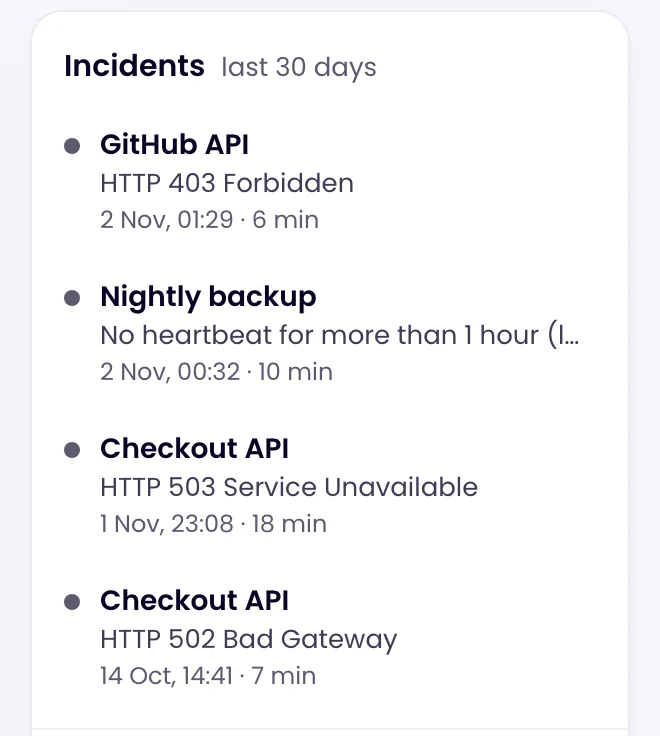
An incident ends Back up on the first good check. It also ends when you pause the monitor, change the address it checks, a maintenance window begins, or the workspace runs out of credits; the timeline says which. The Uptime page lists the last 30 days’ incidents, newest first.