
Uptime monitoring: watch your website, API and servers
An uptime monitor checks a website, an API, a server port, a domain’s DNS or a scheduled job around the clock, from every 30 seconds to every hour. When it stops answering, Monity confirms the failure, alerts you, and tells you again when it is back.
The Uptime page
Open Uptime in the left sidebar, under Site health. A red number beside it counts the monitors that are down right now.
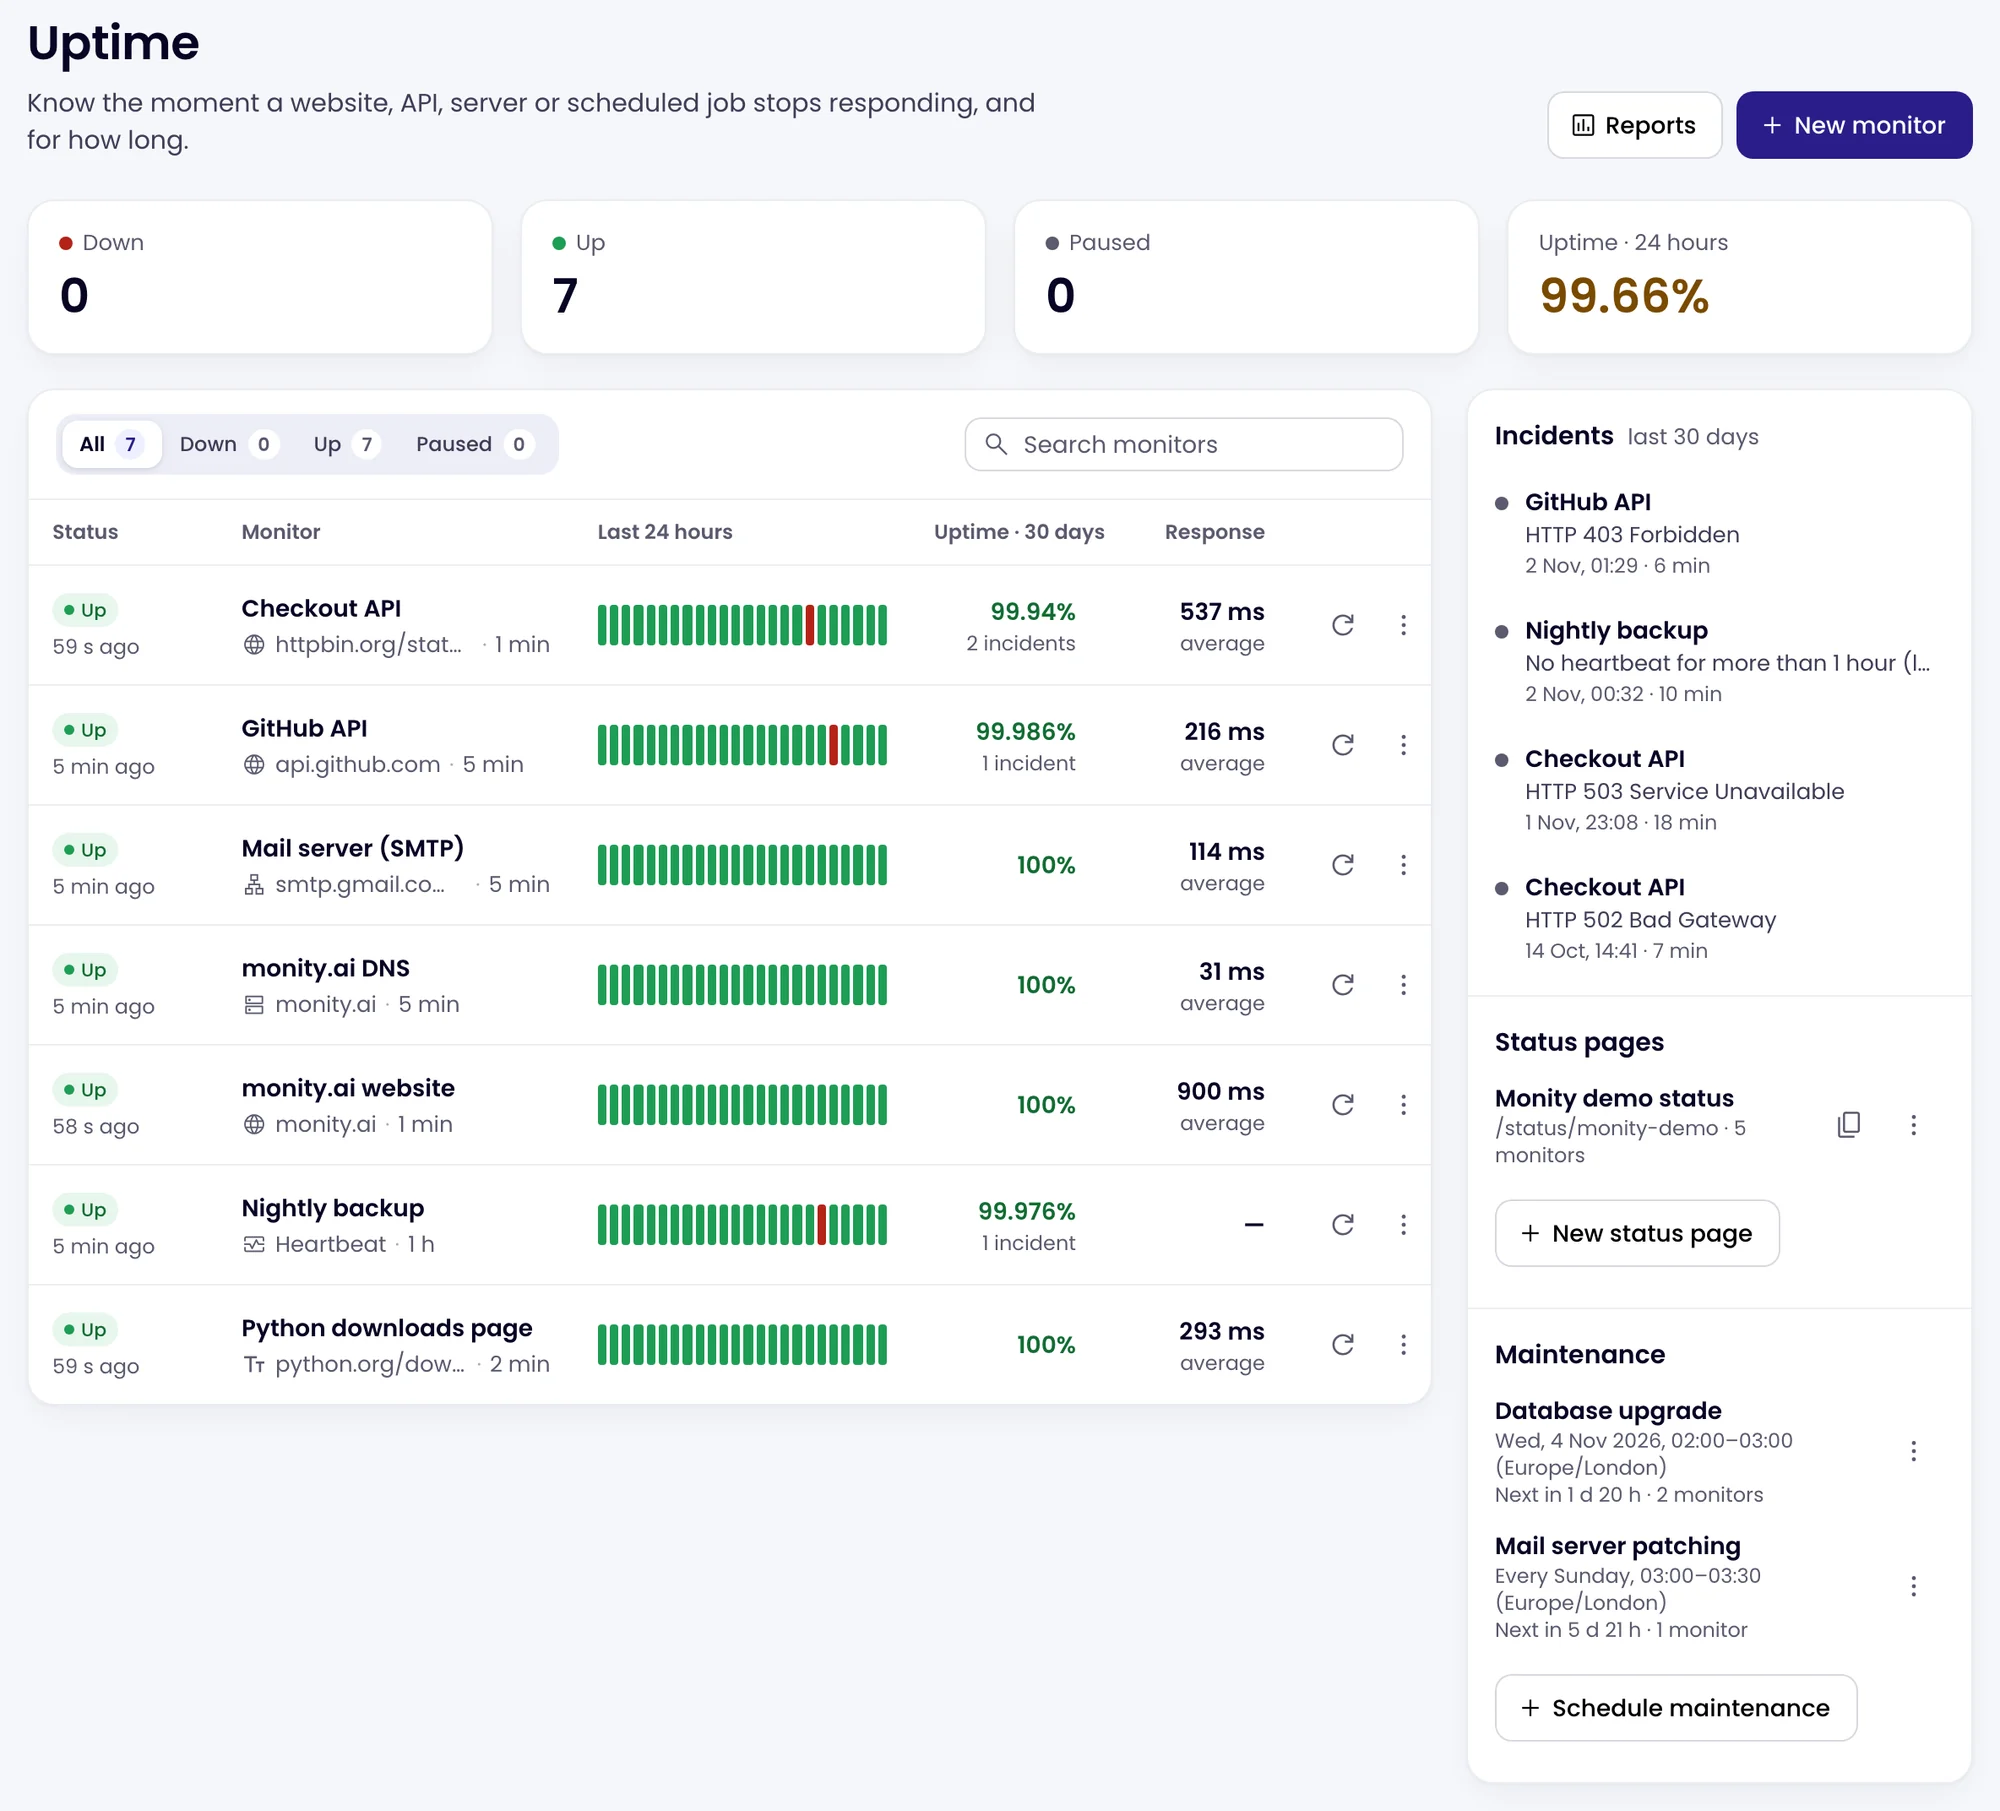
| Part | What it shows |
|---|---|
| Summary | How many monitors are Down, Up and Paused, and the average uptime over 24 hours. A red box above the list names every monitor that is down, with the error and for how long. |
| Monitors | Each monitor’s status and when it was last checked, what it checks and how often, a bar for each of the last 24 hours, its uptime over 30 days and its average response time. Filter by status or search by name. The page refreshes by itself. |
| Incidents | Outages of the last 30 days. Click one to open it on its monitor’s page. |
| Status pages, Maintenance | Your public status pages and maintenance windows. |
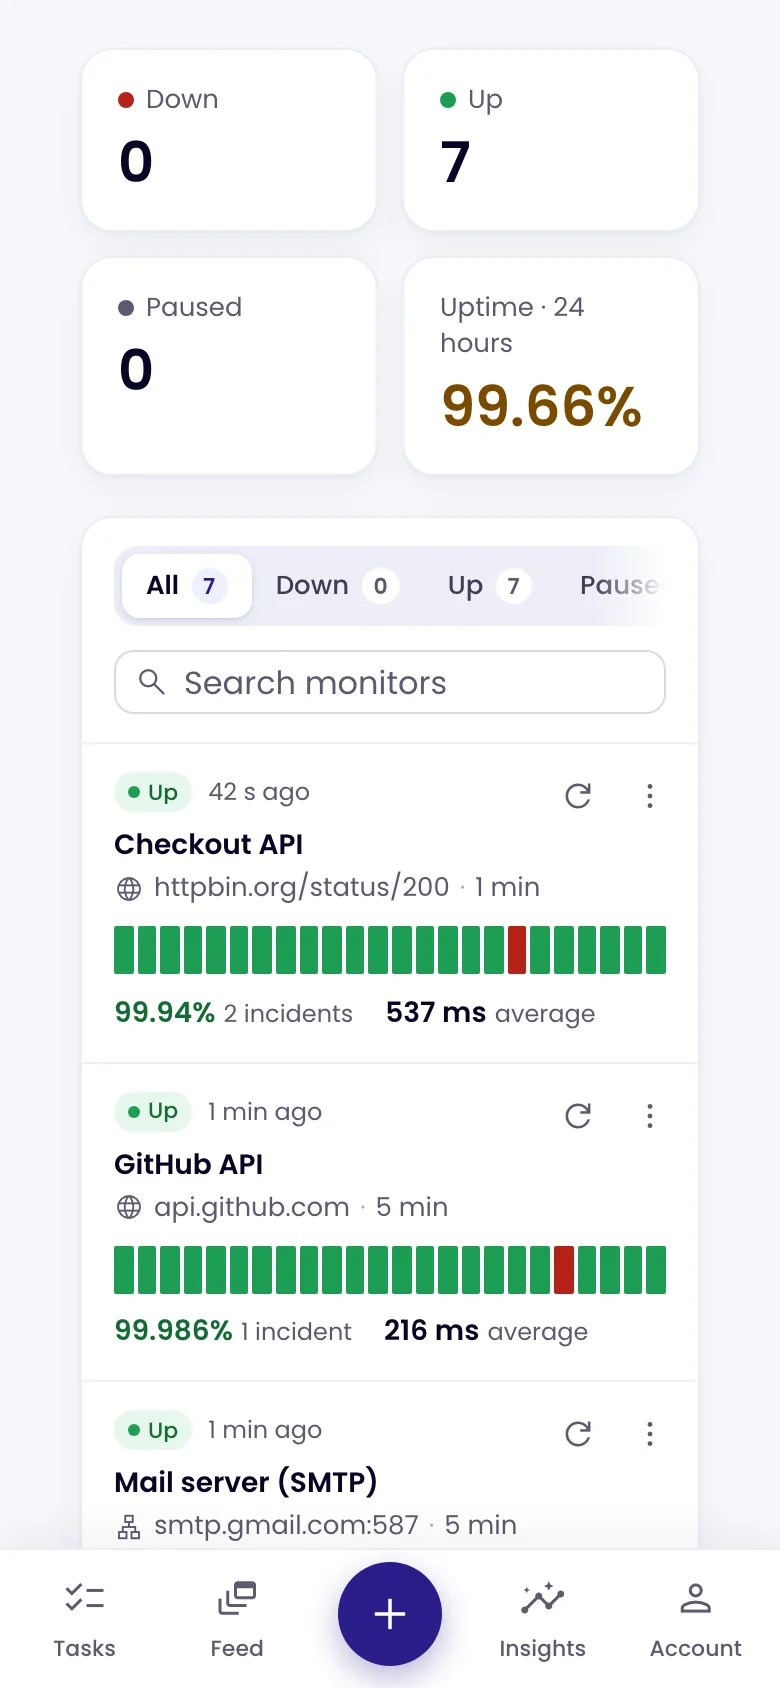
On a phone, the same page shows each monitor as a card with its status, last 24 hours, uptime and response time.
Uptime monitors are tasks too: they appear in the Tasks list with a status tile instead of a screenshot and Uptime as their mode, and their alerts appear in the Feed. They use the same workspaces, labels and alert channels as your other tasks, and count towards your plan’s task limit.
Create your first monitor
-
Start a new monitor
On the Uptime page, click New monitor.
-
Choose what to check
Pick the kind of monitor and enter the address. Website suits most pages and APIs. The Name is optional: it is how the monitor appears in Tasks, Uptime and alerts, and on status pages.
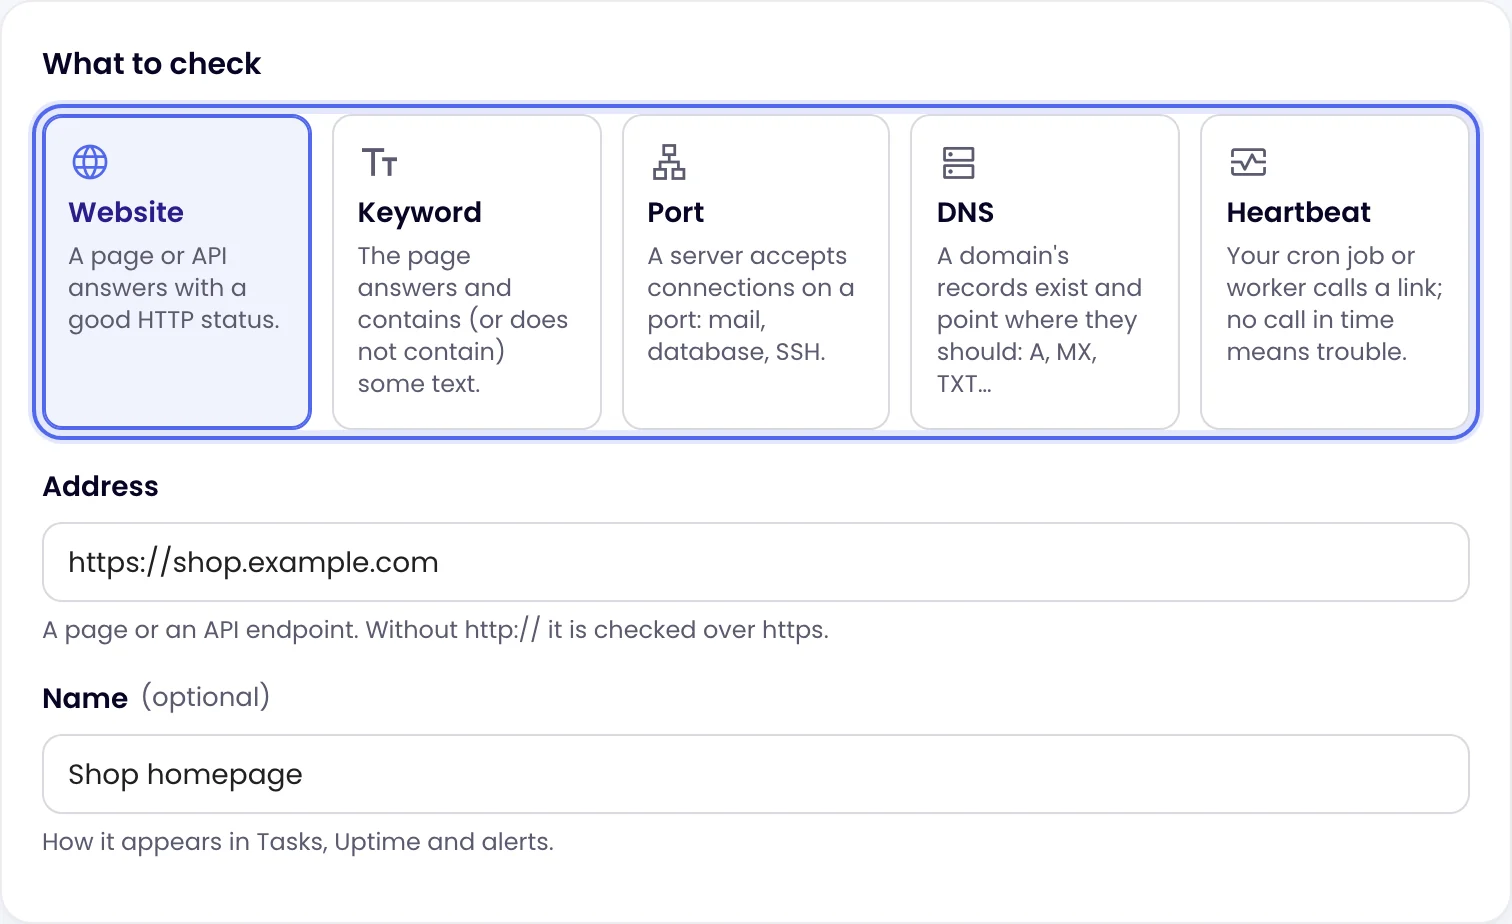
Each kind is explained in Uptime monitor types; scheduled jobs have their own guide, heartbeat monitoring.
-
Set how often
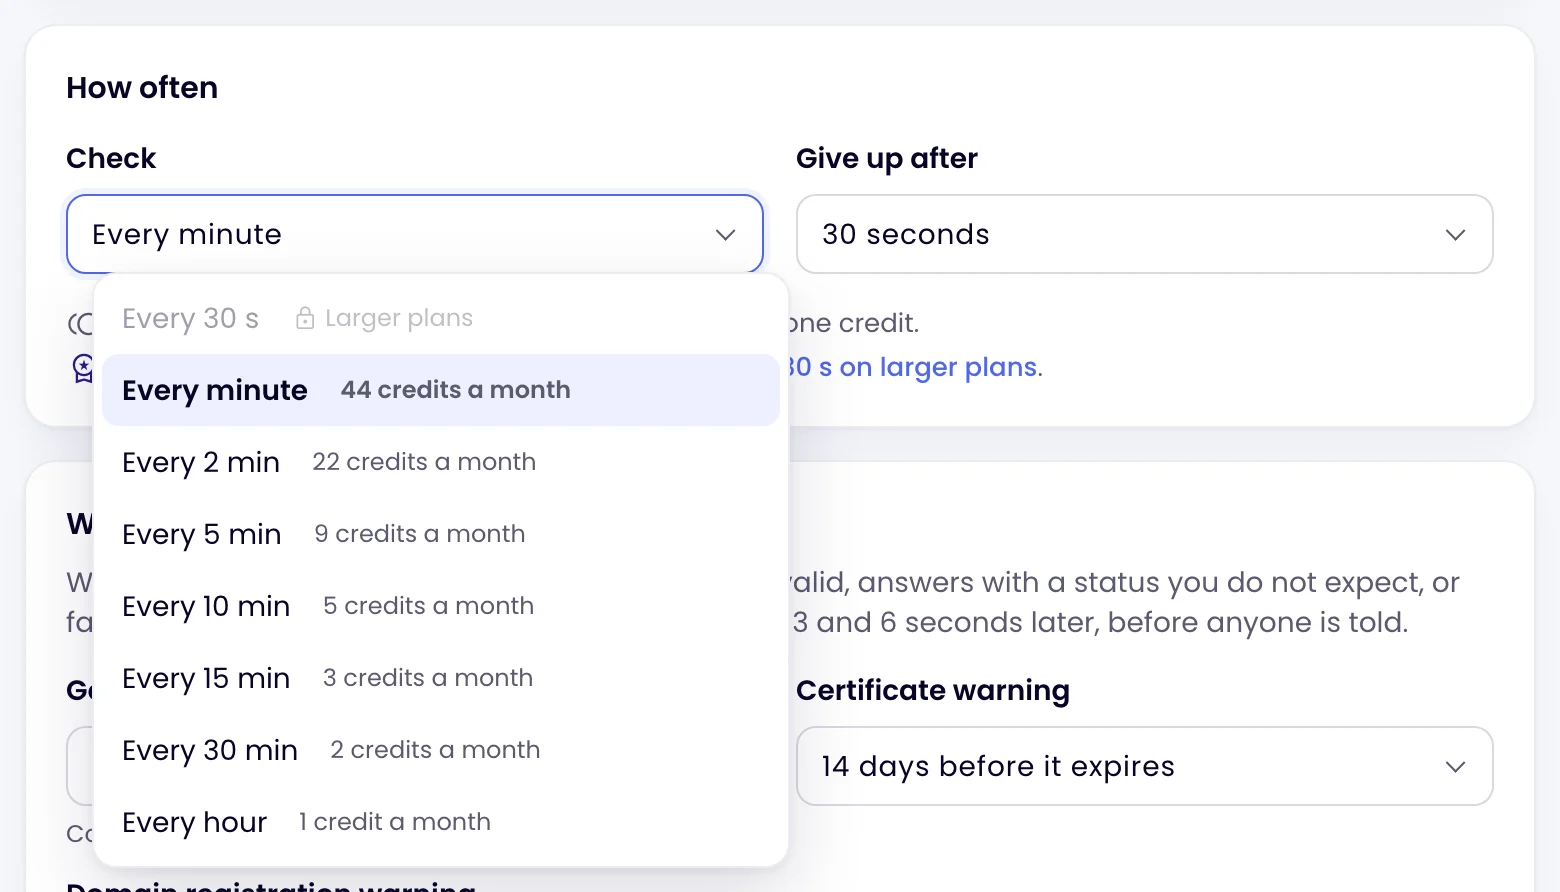
Under How often, choose the interval. Each option shows the credits it uses in a month. Intervals faster than your plan allows are locked and marked Larger plans. Give up after is how long a check waits for an answer (30 seconds by default).
-
Decide when to alert
Under Alerts, choose whether to alert as soon as a failure is confirmed or only after a few minutes down, whether to be reminded while it stays down, and the channels to use. Email is on by default. See Uptime alerts and incidents.
-
Test it, then create it
Click Test now in the Summary on the right. Monity makes one real check and shows whether it would be up, the HTTP status, how long the certificate is valid and where the time went. Then click Create monitor.
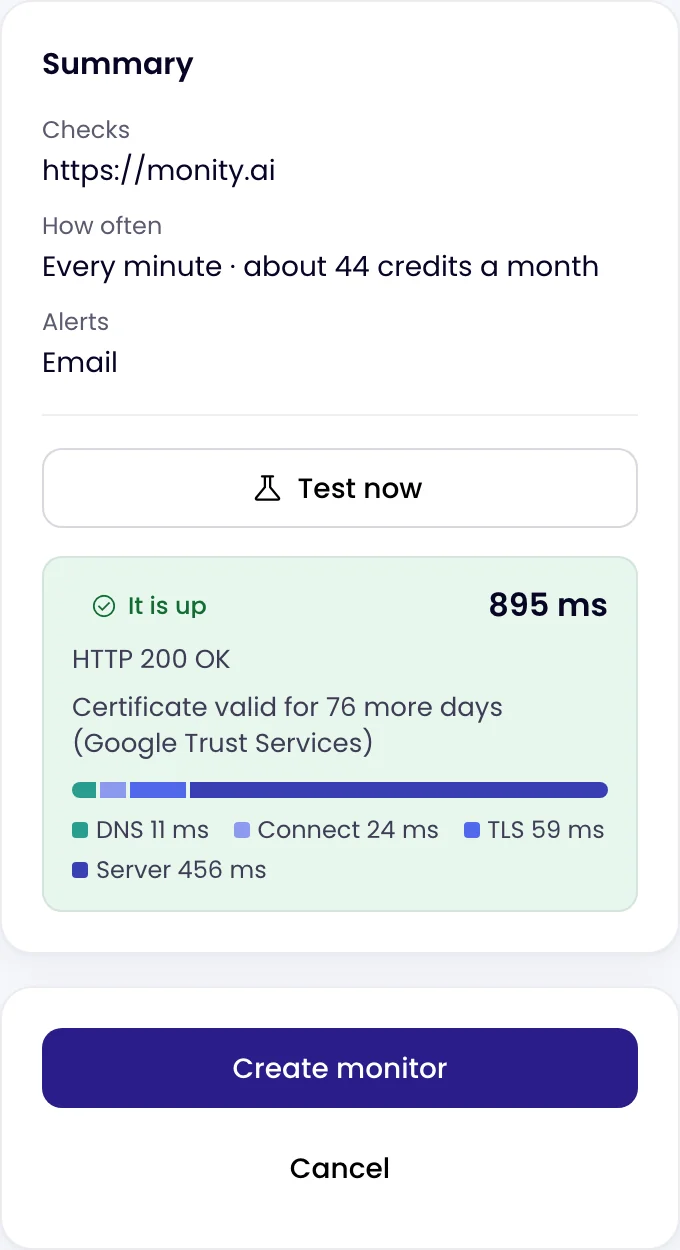
The first check runs straight away. You can also ask Monity AI, for example “tell me when example.com goes down”: it shows the interval and credits in a card before it creates the monitor.
A monitor’s page
Click a monitor’s name to open its page. The top shows its status and for how long, what it checks, how often, and when the last and next checks are. Check now runs a check straight away, Pause stops checks and alerts until you resume, and Edit opens its settings.

Below are the response time over 24 hours, 7, 30 or 90 days (failed checks are shaded), and a bar for each of the last 90 days: green for no downtime, amber for under 1% down, red for more.
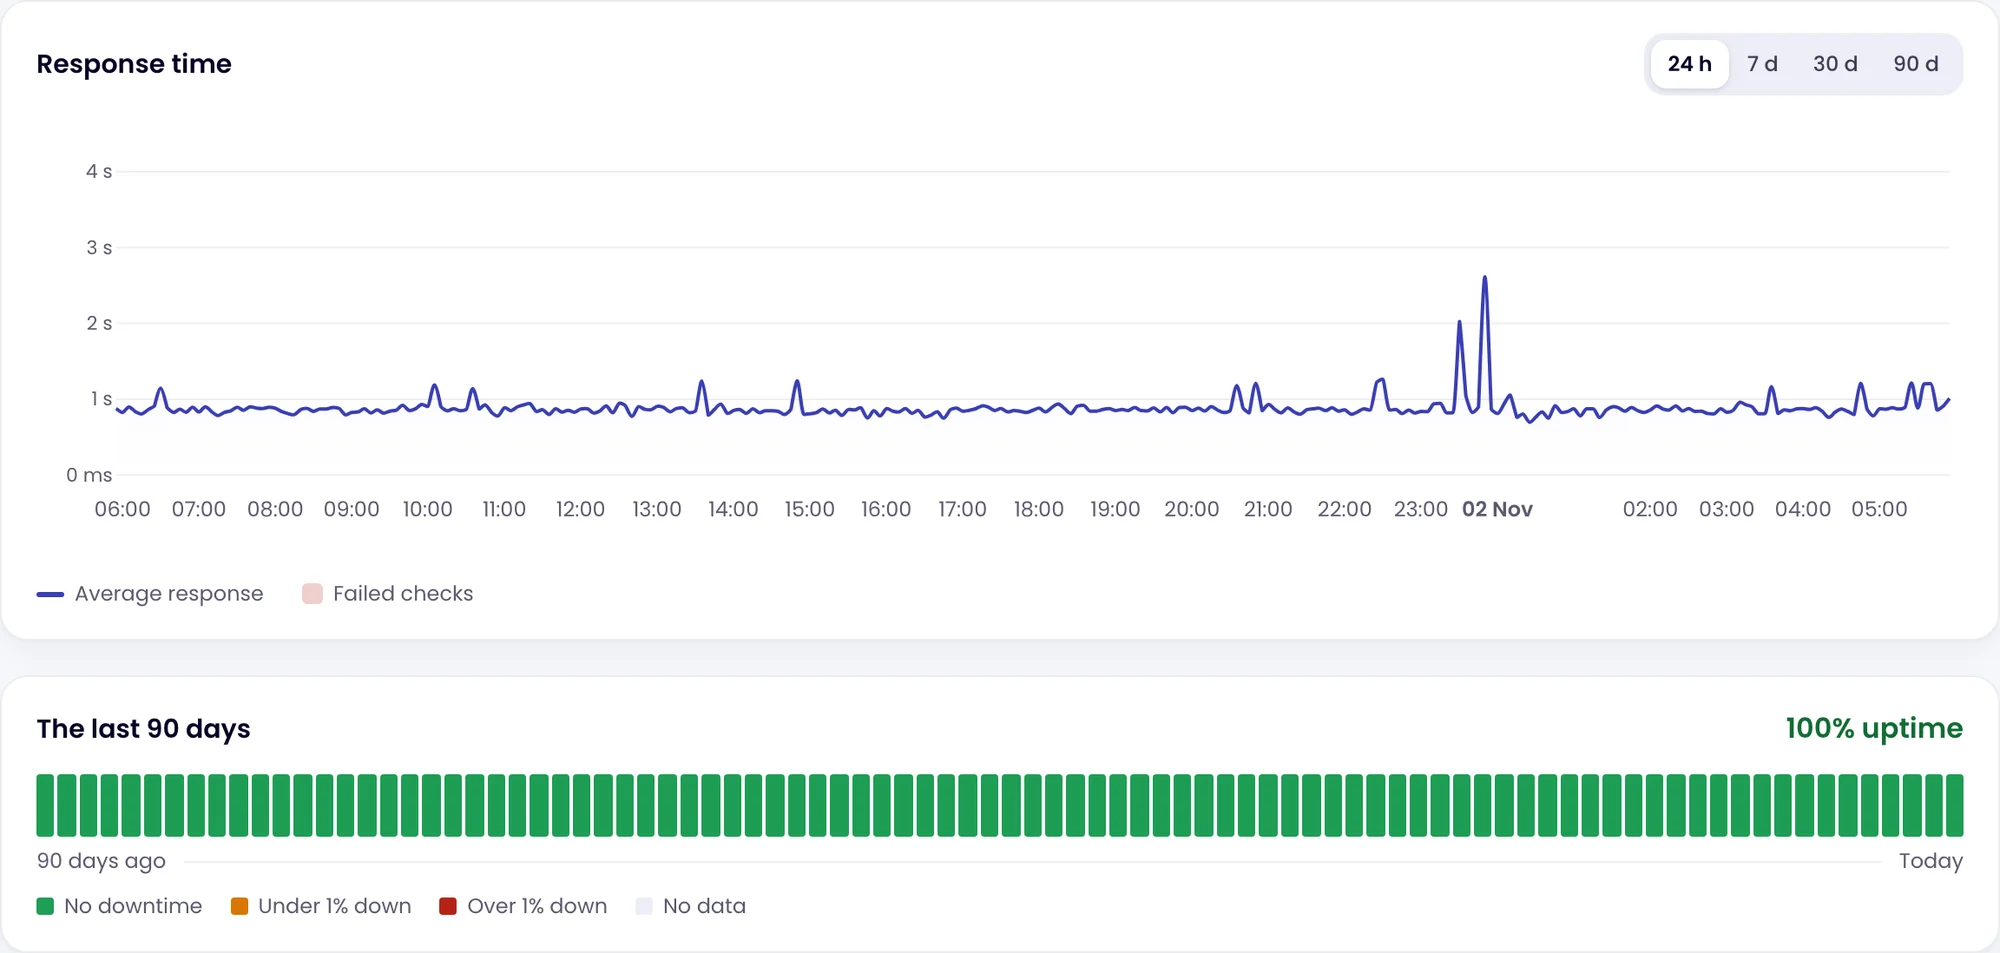
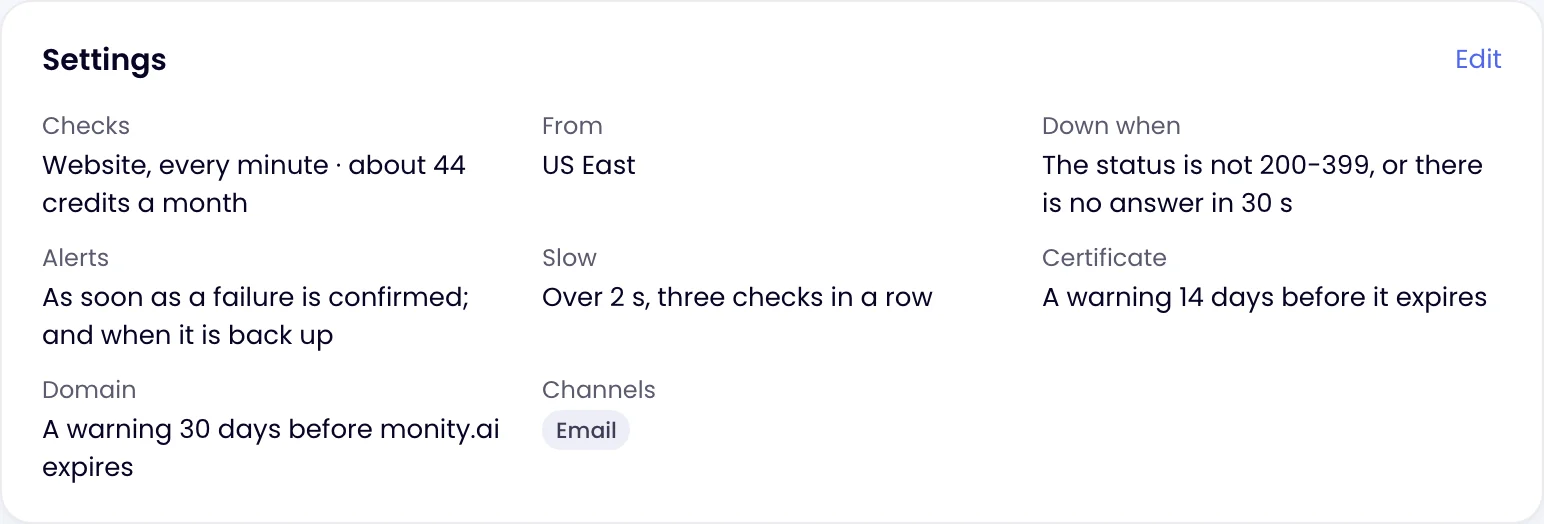
Further down are the monitor’s incidents, its Latest checks with the result and response time of each, and its Settings in plain words.
How a check decides it is down
- A failure is confirmed. When a check fails, Monity checks twice more, 3 and 6 seconds later. Only a failure that repeats starts an incident, so a single dropped request never sends an alert.
- Monity checks itself first. Before a network error (no DNS answer, a timeout, a refused or reset connection) counts, Monity makes sure its own connection works. If its own network is the problem, nothing is alerted.
- One good check ends it. The incident closes on the first successful check, and the recovery alert goes out if a down alert did.
- Uptime counts confirmed downtime. The percentages come from incidents, from the first failure to the recovery. Maintenance windows and pauses are not downtime.
Intervals and credits
1,000 uptime checks use 1 credit, from the balance of the monitor’s workspace. The editor, the monitor’s page and Monity AI show the credits a month before you save.
| Interval | Checks in 30 days | Credits a month |
|---|---|---|
| 30 seconds | 86,400 | About 87 |
| 1 minute | 43,200 | About 44 |
| 2 minutes | 21,600 | About 22 |
| 5 minutes | 8,640 | About 9 |
| 10 minutes | 4,320 | About 5 |
| 15 minutes | 2,880 | About 3 |
| 30 minutes | 1,440 | About 2 |
| 1 hour | 720 | 1 |
How fast a monitor can check depends on your plan:
| Plan | Fastest interval |
|---|---|
| Free, Free Business and the Business trial | 5 minutes |
| Small and Medium plans (Personal, Business and pay-as-you-go) | 1 minute |
| Large plans and up | 30 seconds |
If a workspace runs out of credits, its monitors stop checking and show Not checking: no credits left. They start again by themselves when there are credits again. See Credits and plans, the pricing page for what each plan includes, and the uptime monitoring page for an overview of the feature.
In the desktop app, Uptime checks from your computer while it is on, without credits. Heartbeat monitors and status pages need an address on the internet, so they are only in the web app.