
Insights
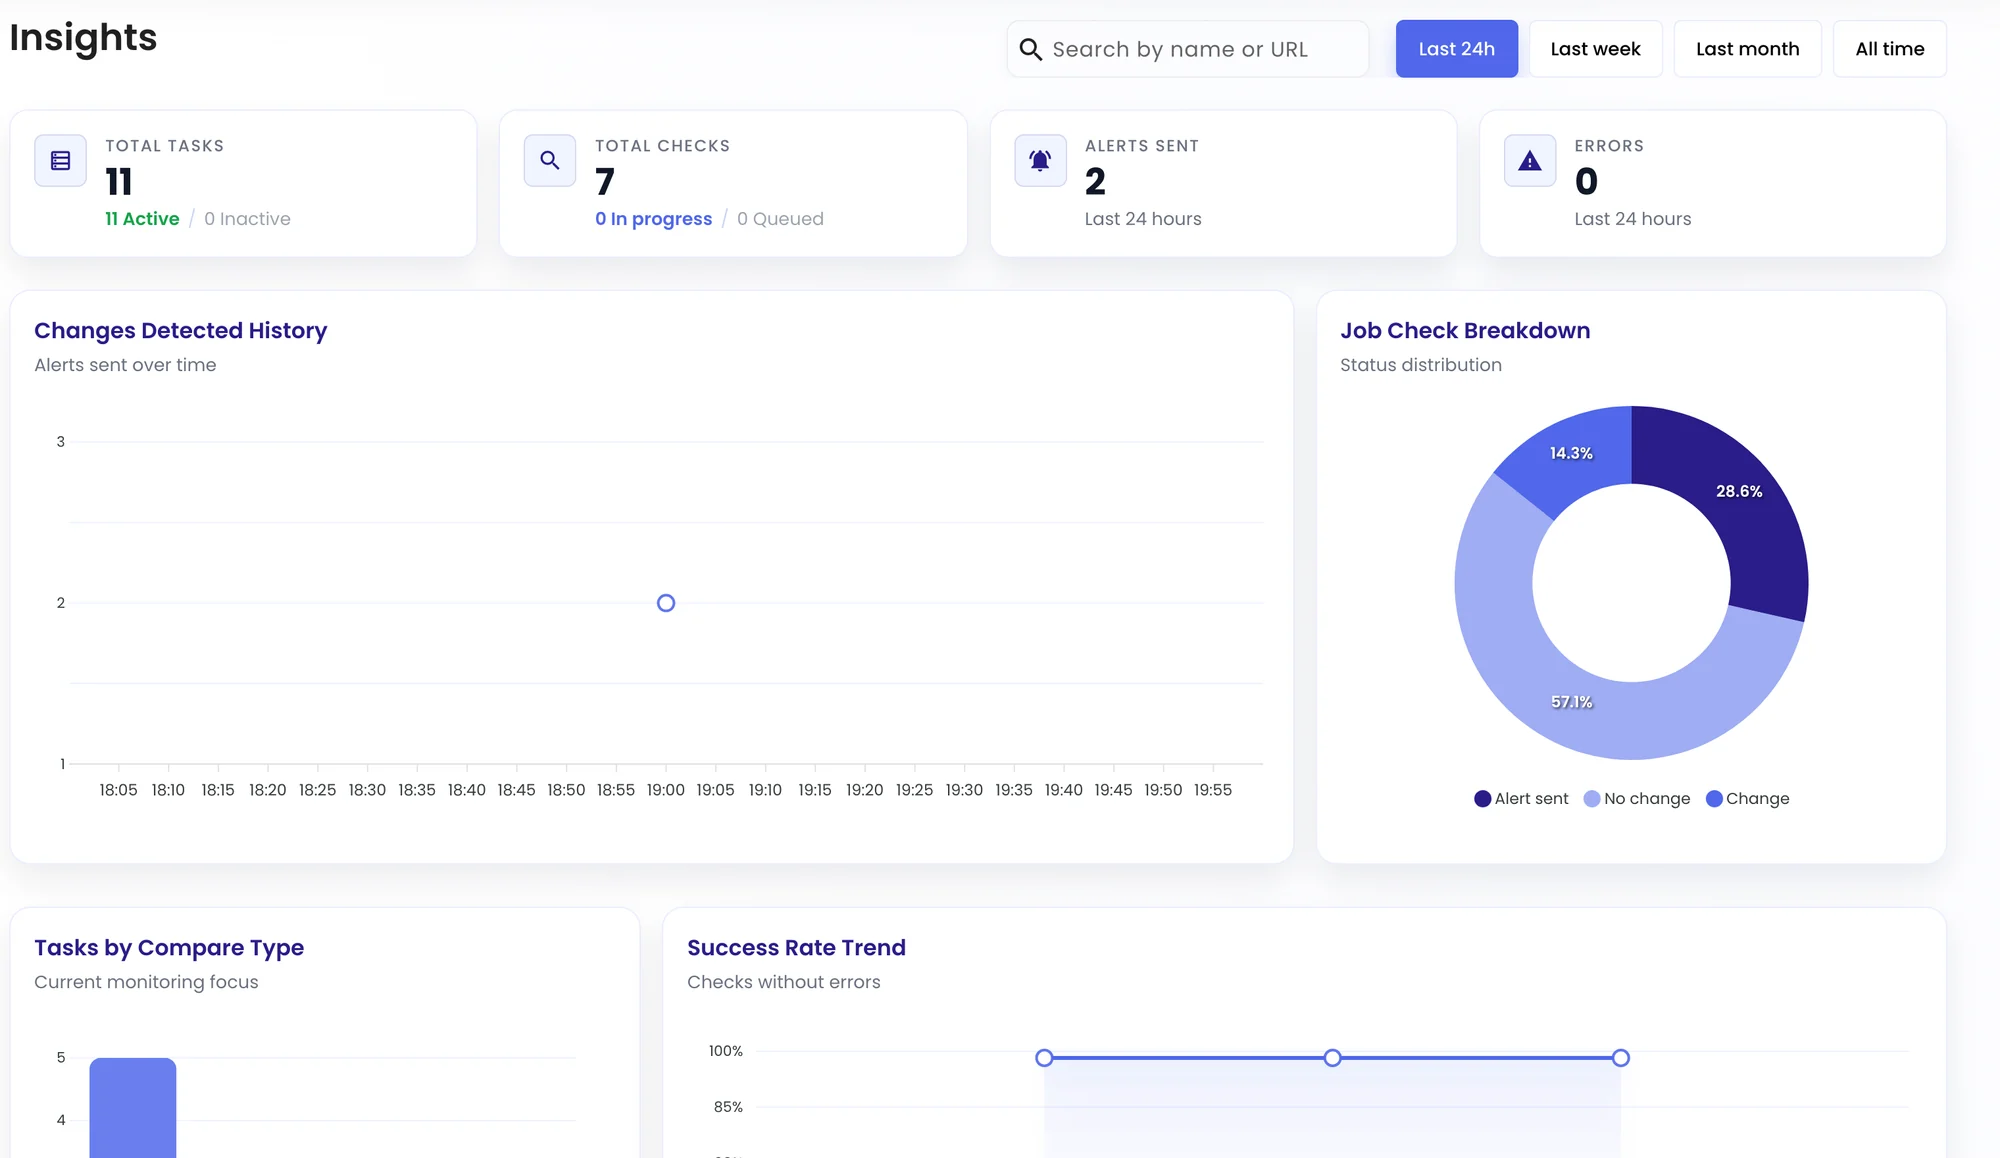
Insights gives you the numbers behind your monitoring: how many tasks and checks are running, how many alerts went out, and how checks have gone over time.
Open Insights
Click the chart icon in the left-hand menu. Choose a period at the top (Last 24h, Last week, Last month or All time) and search by name or URL to focus on certain tasks.
| Panel | Shows |
|---|---|
| Total tasks | Active and inactive tasks. |
| Total checks | Checks in the period, and those in progress or queued. |
| Alerts sent | How many alerts went out. |
| Errors | Checks that couldn’t complete. See Troubleshooting. |
| Changes Detected History | Alerts sent over time. |
| Job Check Breakdown | The share of checks that alerted, changed or found no change. |
| Tasks by Compare Type | How many tasks use each monitoring mode. |
| Success Rate Trend | The share of checks that ran without errors. |
Was this page helpful?