
Core Web Vitals monitoring with alerts
Monity times your page in a real browser on every check, logged-in pages included. When largest contentful paint stays above 2.5 seconds for two checks in a row, you get one alert, not one per check.
- On the free plan
- Largest contentful paint on every check
- One alert per slowdown

Measured on every check
The same browser visit that checks the page also times it.
Every check opens your page in a real browser. The skill reads that browser’s own timings: largest contentful paint, server response, first paint and full load, plus page weight, requests and the slowest files, and layout shift when the check runs in a Chromium-based browser. LCP is recorded before Monity scrolls the page for its screenshot, so it describes the page, not the capture.
- A speed score out of 100 next to the numbers
- Where the time went: DNS, connection, TLS and download
- Delivery checks: compression, caching, render-blocking scripts
Alerts you can leave on
One slow check is noise. Two in a row is an alert.
One visit is one sample of the network, so timing rules wait for two checks in a row over the threshold. Then they alert once for the whole slowdown, not on every check while it lasts, and only start counting again after the page is back under. The first check sets the baseline; nothing alerts on it.
- Largest contentful paint above 2.5 s is on from the start
- So is a drop of 10 points in the speed score
- Set your own thresholds and checks in a row, per task
Where speed tests can’t go
Checkout, account and dashboard pages, timed the way your customers load them.
Public speed tests stop at a login. A Monity task can sign in first, with recorded steps or a saved browser session, then time the page behind it: the dashboard your customers open every morning, the basket, the checkout. Those are the pages where a slow release costs the most and is noticed last.
- Saved sessions (devices) on paid plans and the Business trial
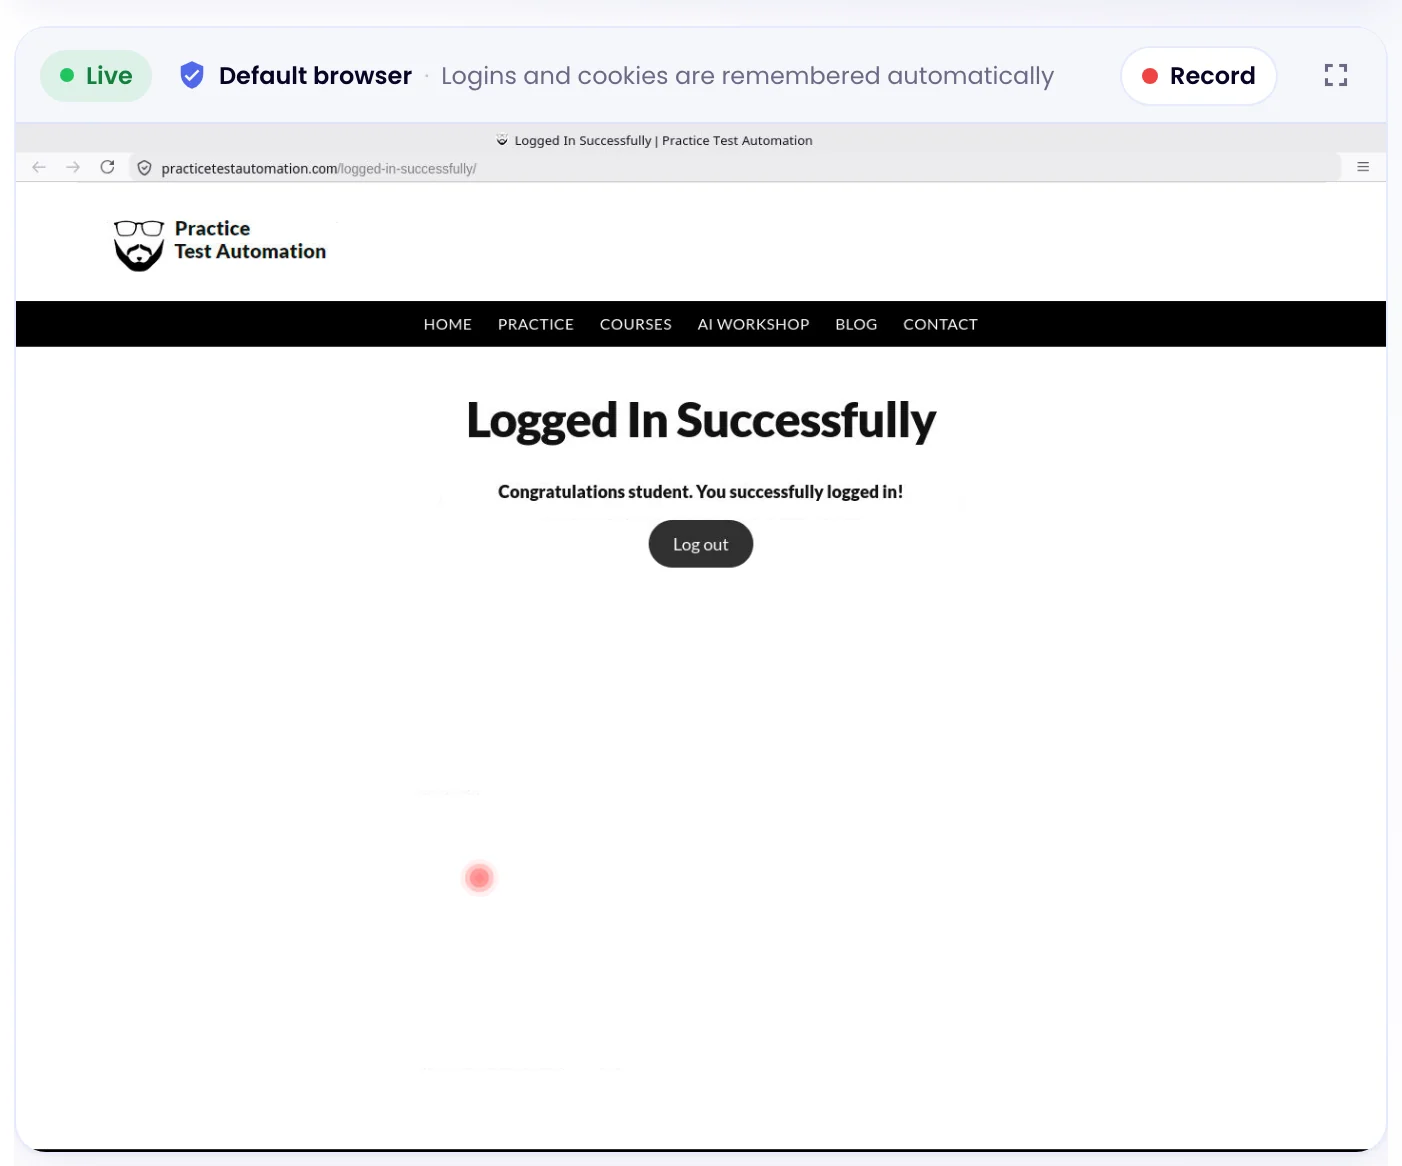
- The free plan can sign in through its own live browser
Alert rules
Nine rules. Two are on from the start.
Every rule is a switch on the task, with its own threshold and how many checks in a row it needs. These are the defaults a new task starts with.
Speed & Core Web Vitals
Every plan, free included| Rule | New tasks | Default | What it catches |
|---|---|---|---|
| Largest contentful paint above | On | 2.5 s, 2 checks in a row | How long the biggest image or block of text takes to appear. Google calls anything over 2.5 seconds slow. |
| Layout shift above | Off | 0.1, 2 checks in a row | How much the page jumps around while it loads (Google’s limit is 0.1). Only Chromium-based checks report it; most checks run in a Firefox-based browser, so it starts off. |
| Speed score drop | Off | 10 points from one check to the next | The speed score out of 100 fell sharply since the previous check. Off by default: one slow visit is enough to trip it. |
| Server response above | Off | 1.8 s, 2 checks in a row | How long the server takes to start answering, redirects included. Usually the server or its cache. |
| First contentful paint above | Off | 3 s, 2 checks in a row | How long until anything at all appears on screen. |
| Full page load above | Off | 6 s, 2 checks in a row | How long until the page and everything on it has finished loading. |
| Page weight above | Off | 3 MB, 2 checks in a row | Everything the browser downloaded for the page. A heavy page is a slow page on a phone. |
| Requests above | Off | 150, 2 checks in a row | How many files the page loads. A sudden jump usually means a new tag, widget or tracker. |
| Speed score below | Off | 50/100, 2 checks in a row | The overall speed score for a check, out of 100. |
Thresholds follow Google’s guidance for a good page: largest contentful paint up to 2.5 s, layout shift up to 0.1. Interaction to next paint (INP) needs real visitors clicking, so no page visit can measure it.
Examples
Ask for it in a sentence. Get an alert that names the cause.
Tell the assistant what to watch, or switch the skill on in a task’s settings. Alerts go to the channels you turn on for the task.
-
 Alert me if coastalcrm.com/pricing takes longer than 2.5 seconds to load
Largest contentful paint above: 3.40 s (threshold 2.50 s, 2 checks in a row). Two hourly checks over the line. The first slow check names the cause: +1.2 MB of images.
Alert me if coastalcrm.com/pricing takes longer than 2.5 seconds to load
Largest contentful paint above: 3.40 s (threshold 2.50 s, 2 checks in a row). Two hourly checks over the line. The first slow check names the cause: +1.2 MB of images. Slack · #web-performance
-
Tell me if fieldnote.com gets slower after a release
Speed score drop: 88/100 → 61/100 (down 27 points). Since the last check: a new slow script from a chat widget, 1.40 s.
 Email · dev-team@fieldnote.com
-
Watch the Northwind checkout and tell me if the server takes over 1.8 seconds to answer
Server response above: 2.10 s (threshold 1.80 s, 2 checks in a row). The checkout is signed in with a saved session, so it is the page customers get.
 Microsoft Teams · E-commerce · Web
-
Keep the homepage under 3 MB and alert me when it isn’t
Page weight above: 3.6 MB (threshold 3.0 MB, 2 checks in a row). The webhook carries a skillAlerts list your pipeline can act on.
 Webhook · Deploy pipeline
Coastal CRM, Northwind and Fieldnote are example companies.
Free tools
Test a page now, then keep testing it.
The free speed test loads a page once in a real browser and shows the same kind of timings. Monitoring takes them on every check and tells you when they change.
FAQ
Questions about Core Web Vitals monitoring
What is Core Web Vitals monitoring?
Which Core Web Vitals does Monity measure?
Are these the same numbers as Google Search Console?
Why two checks in a row before an alert?
What does “what got heavier” mean?
Does the skill use extra checks?
Is it on the free plan?
Hear about the slowdown before your customers do.
Add Speed & Core Web Vitals to a task and Monity times the page on every check, with an alert when it crosses your line.
- Free plan: 3 tasks, no card
- 7-day Business trial
- Every alert channel on every plan